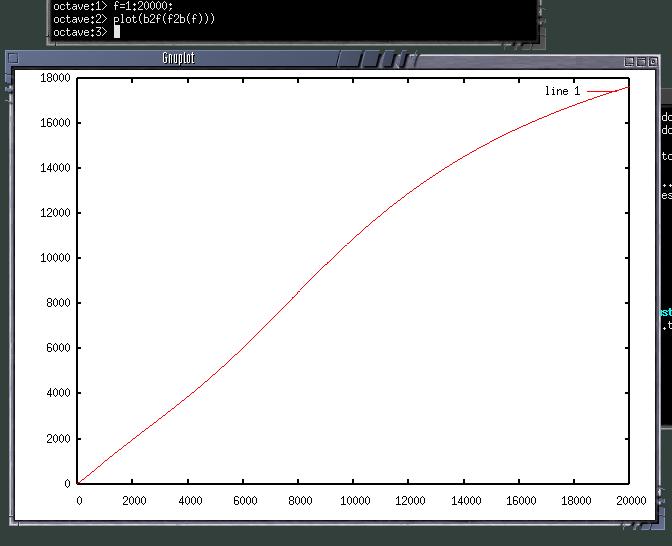
Hi,

I am implementing :
a] Bark scale to frequency and
b] frequency to Bark scale
equations.

I have found an old posting from the auditory list to help with this.

Would anyone have constructive criticism on the attatched scripts ?

The execution of the following in octave plots the jpg (attatched).
octave:1> f=1:20000;
octave:2> plot( b2f( f2b(f) ))

In my opinion it should be a straight line.

Matt

--
http://mffm.darktech.org

WSOLA TimeScale Audio Mod  : http://mffmtimescale.sourceforge.net/
FFTw C++                   : http://mffmfftwrapper.sourceforge.net/
Vector Bass                : http://mffmvectorbass.sourceforge.net/
Multimedia Time Code       : http://mffmtimecode.sourceforge.net/
function f=b2f(z)
  %# returns f in Hz for bark scale value z
  %# from here http://www.auditory.org/postings/1995/34.html

  f=((exp(0.219*z)/352)+0.1).*z-0.032*exp(-0.15*(z-5).^2);
  f=f*1000;
endfunction
function b_0=f2b(f)

  %# calculates the bark band location of f in Hz

  %# from here http://www.auditory.org/postings/1995/34.html
  b_0=13*atan(0.76*f/1000)+3.5*atan((f/1000).^2/56.25);

  %#Schroeder (1977)
%#  b_1 = 7*asinh(f/650);

  %# Traunm?ller (1990)
%#  b_2 = 26.81./(1+(1960./f)) - 0.53;

  %# Terhardt (1979)
%#  b_3 = 13.3*atan(0.75*f/1000);
%#  b_3= 12.82*atan(0.78*f/1000) + 0.17*(f/1000).^1.4;

  %# Zwicker & Terhardt (1980)
%#  f=f/1000;
%#  b_4=13*atan(0.76*f)+3.5*atan(f/7.5).^2;


%#  plot(b_1); hold on
%#  plot(b_2); plot(b_3); plot(b_4); hold off

endfunction
Attachment:
result.jpg
Description: JPEG image